
Python Data Visualization Cookbook#2
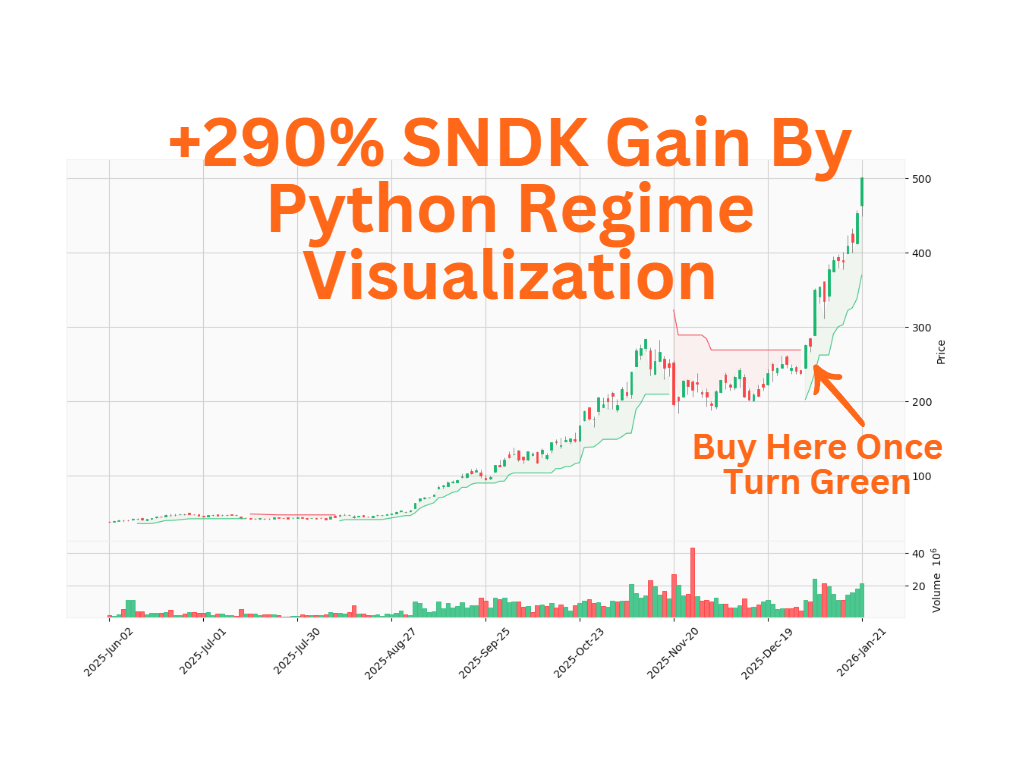
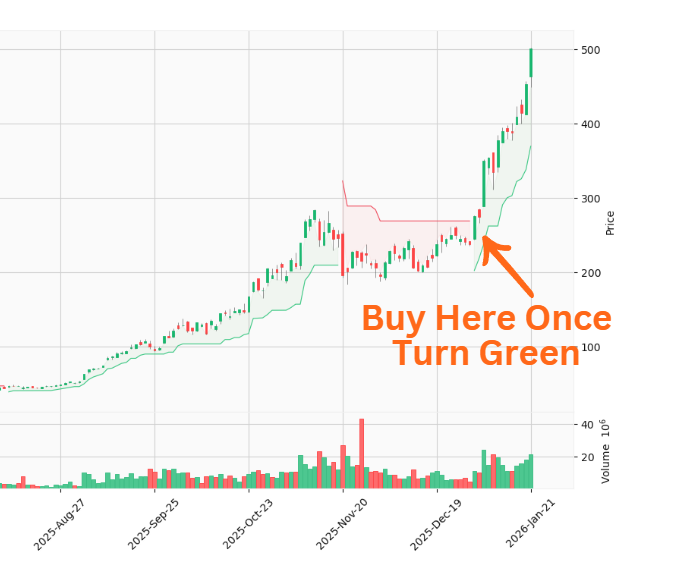
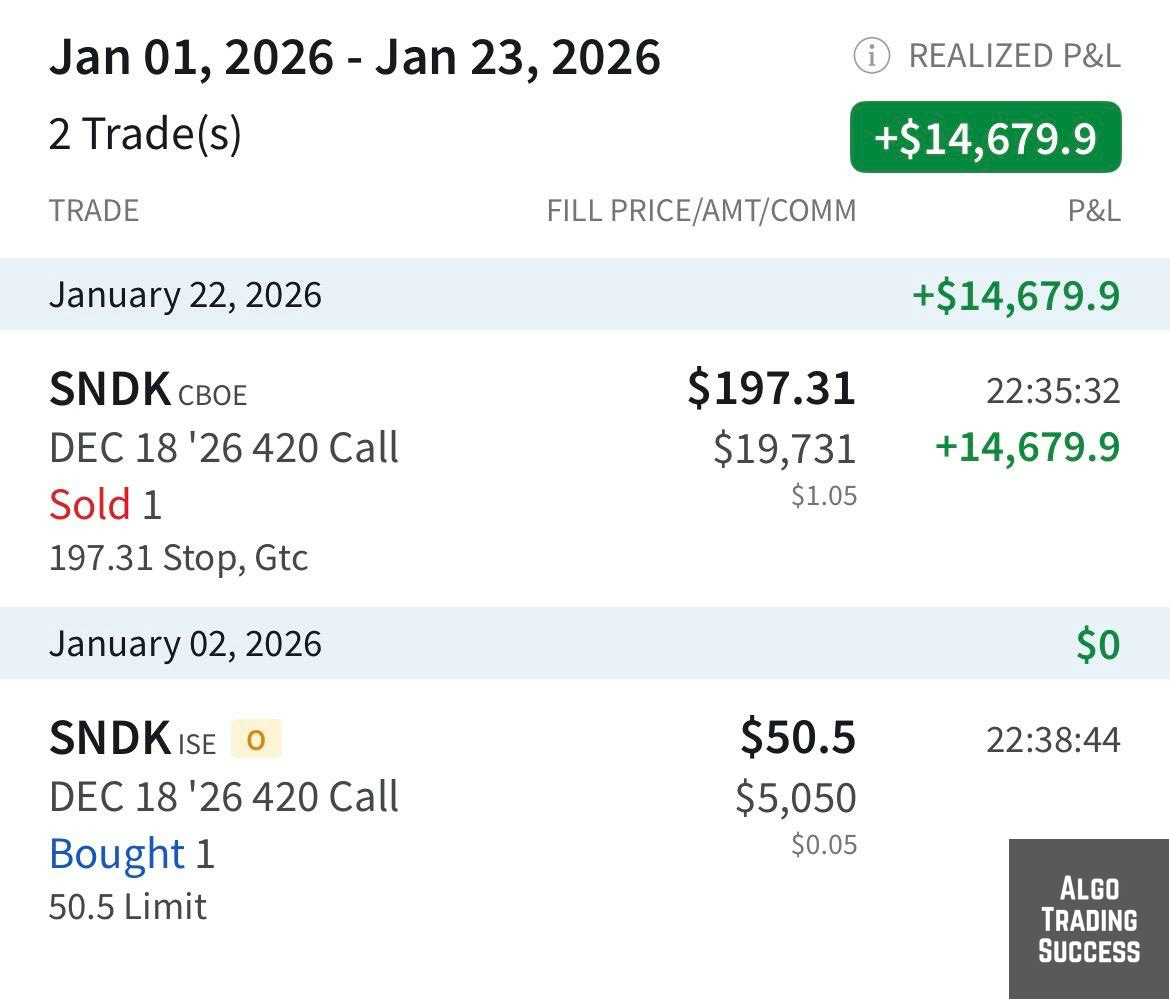
This Regime Visualization Tool Helped Me To Gain +290% From SNDK Option

Disclaimer: Material presents for SNDK is data visualization methodologies for discretionary trading analysis. Content is strictly educational and does not constitute financial advice, investment recommendations, or professional guidance. Past performance illustrated does not guarantee future results.
This is part 2 of the data visualization. Full code available for paid subscriber. For FREE python visualization code, you can access to part 1 in my previous post:

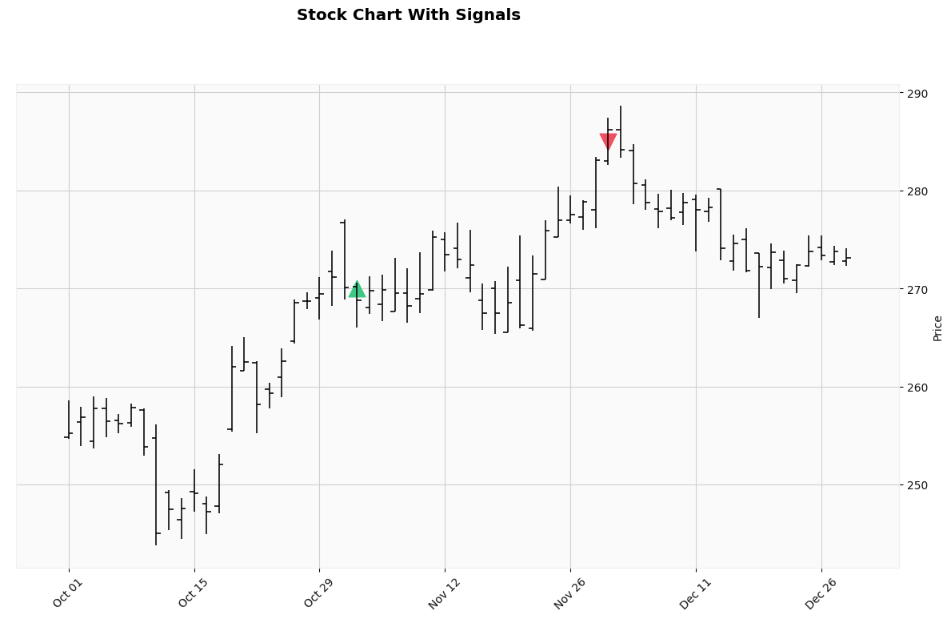
9. Stock Price Trend Visualization
Use Case: Observe the price trend for a stock
When to Use: To analysis stock price if it is up trend or down trend.
Importance (9/10): Essential for stock price regime identification for applying right strategy
I bought SNDK option once turn green from red
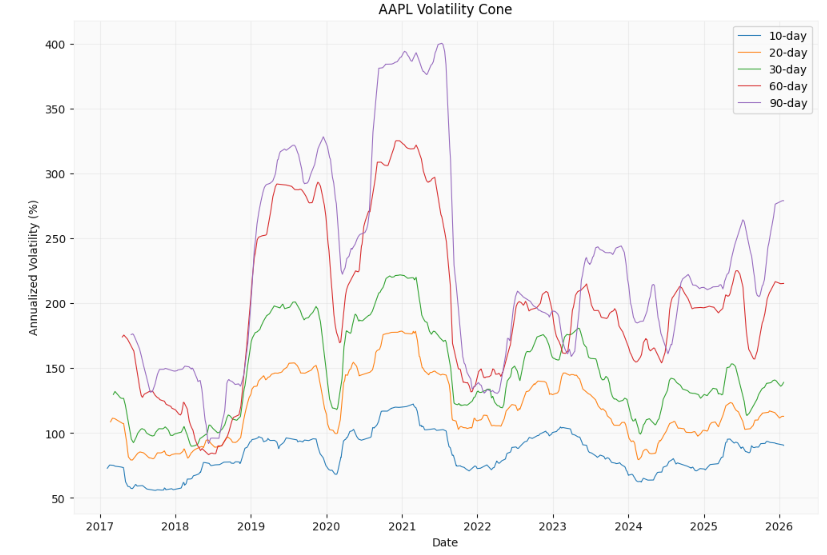
10. Volatility Cone
Use Case: Comparing current volatility to historical volatility ranges across different periods.
When to Use: Options trading, volatility forecasting, and mean reversion strategies.
Importance (8/10): Critical for options trading and volatility analysis.
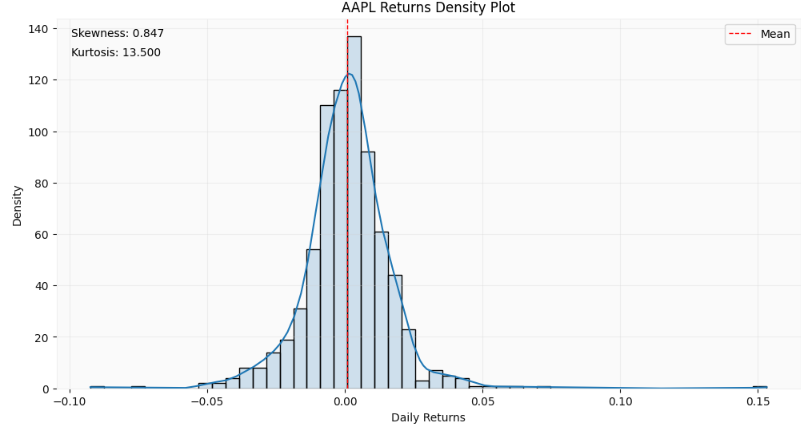
11. Returns Histogram
Use Case: Analyzing return distribution characteristics and identifying statistical properties.
When to Use: Risk assessment, tail risk analysis, and distribution modeling.
Importance (9/10): Essential for risk management and statistical analysis.
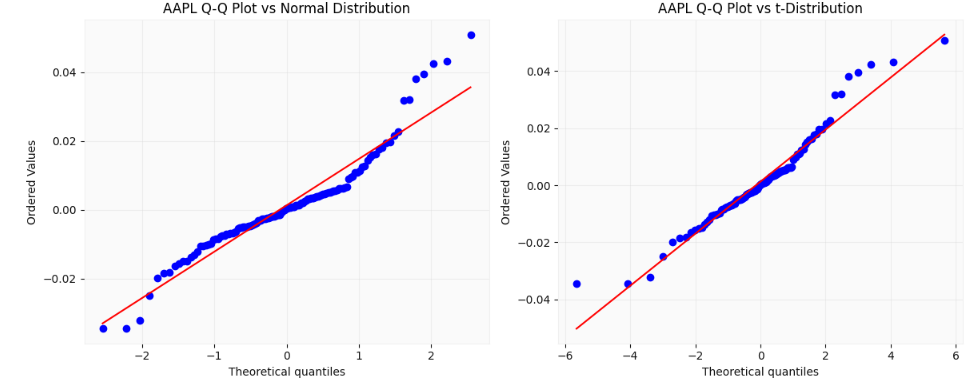
12. Q-Q Plot
Use Case: Testing if returns follow a normal distribution through quantile comparison.
When to Use: Distribution testing, risk model validation, and normality assessment.
Importance (8/10): Critical for risk model validation and distribution testing.
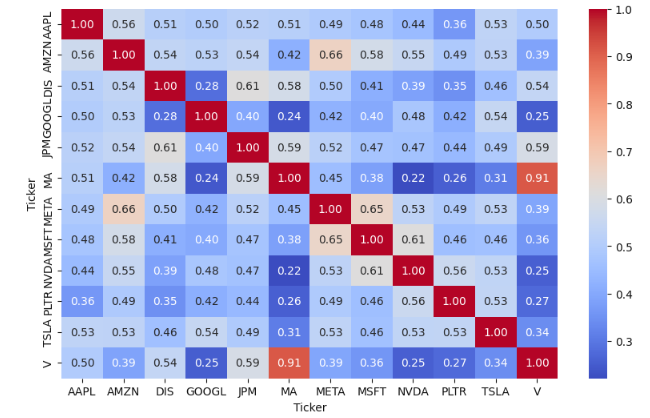
13. Correlation Heatmap
Use Case: Visualizing correlation matrix between multiple securities or indicators.
When to Use: Portfolio analysis, diversification assessment, and relationship identification.
Importance (9/10): Essential for portfolio construction and risk management.
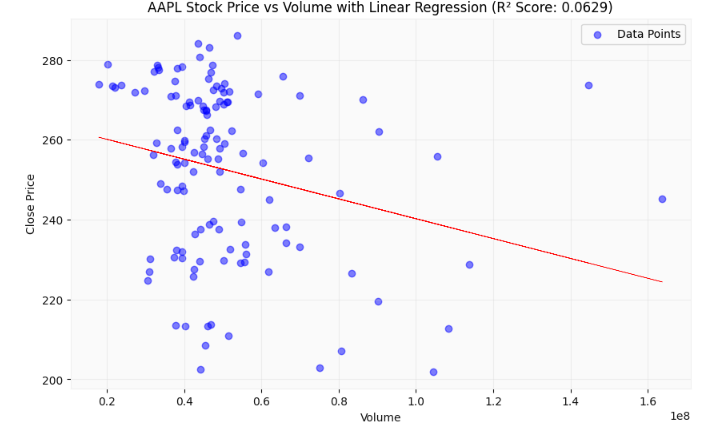
14. Linear Regression Plot
Use Case: Analyze how much of the dependent variable (outcome) can be explained by independent variable (factor)
When to Use: Explore the factor if it is significant driver of dependent variable to build a model.
Importance (9/10): Fast and simple for alpha factor modelling
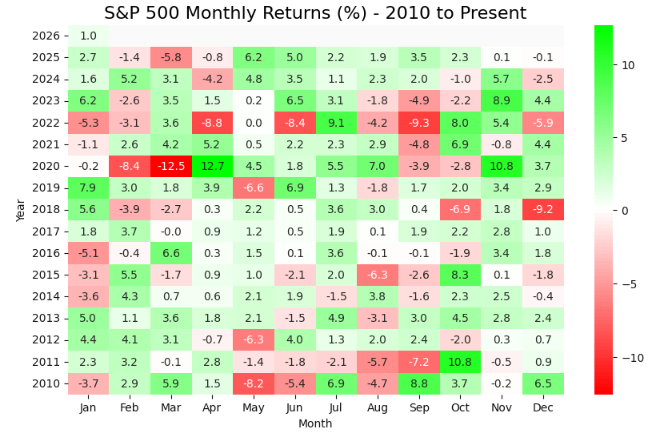
15. Monthly Return Heatmap
Use Case: View the monthly return of an asset
When to Use: Observe the monthly performance pattern
Importance (8/10): Essential for market outlook
16. Trade Signal Display
Use Case: Annotate trade signals in a stock chart.
When to Use: To analysis the buy/sell signal generated from the algo.
Importance (10/10): Essential for troubleshoot, monitoring, visualize the trading signal.
⚠️ Disclaimer: The content provided is intended solely for educational purposes and reflects the author’s personal experiences with data insights, backtesting and algorithmic trading. It does not constitute financial advice, investment recommendations, or financial services. All references to securities or financial instruments are for illustrative purposes only and should not be construed as endorsements or recommendations for trading. Performance figures presented are based on hypothetical backtested results, which are not indicative of future performance. Trading systems may contain errors, and no warranties are made regarding their accuracy or functionality. Past performance does not guarantee future results. Individuals are strongly advised to conduct thorough due diligence, including but not limit to forward testing in paper or simulated accounts for an appropriate duration, before deploying any trading strategy with real capital. Trading carries significant risks, including high volatility and the potential for complete loss of invested capital. Live trade the strategy at your own risk, as any losses incurred are not the responsibility of the author.
🚨 Don’t Want To Miss A +290% Gain?
The complete source code in Google Colab is available for Paid members. Included the regime visualization helped me to gain +290%!
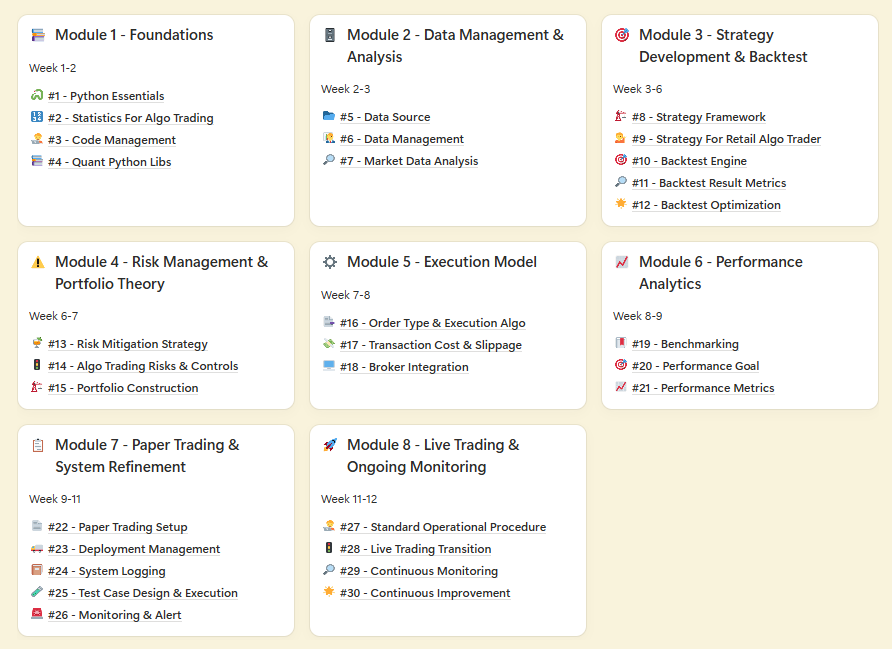
BONUS For Paid Member ONLY - “Champion’s Fast Lane Playbook: Master Algo Trading in 12 Weeks” - My 8 modules self-study guides and notes for building a winning strategy.
⬇️⬇️⬇️